
Most retailers track sales, but this data alone can’t explain why one day feels smooth and another feels chaotic despite similar revenue. The missing layer is visibility into when visitors arrive, how demand spikes by hour, and when service capacity fails on the floor.
That’s where retail footfall insights become operational. In 2026, top-performing chains use footfall as a management input as it helps turn “busy” into measurable patterns that can be acted on.
However, your footfall insights are only as useful as the quality of the signal. If the underlying measurement is inconsistent, your decisions will be inconsistent too.
What “Retail Footfall Insights” Mean for Store Operations
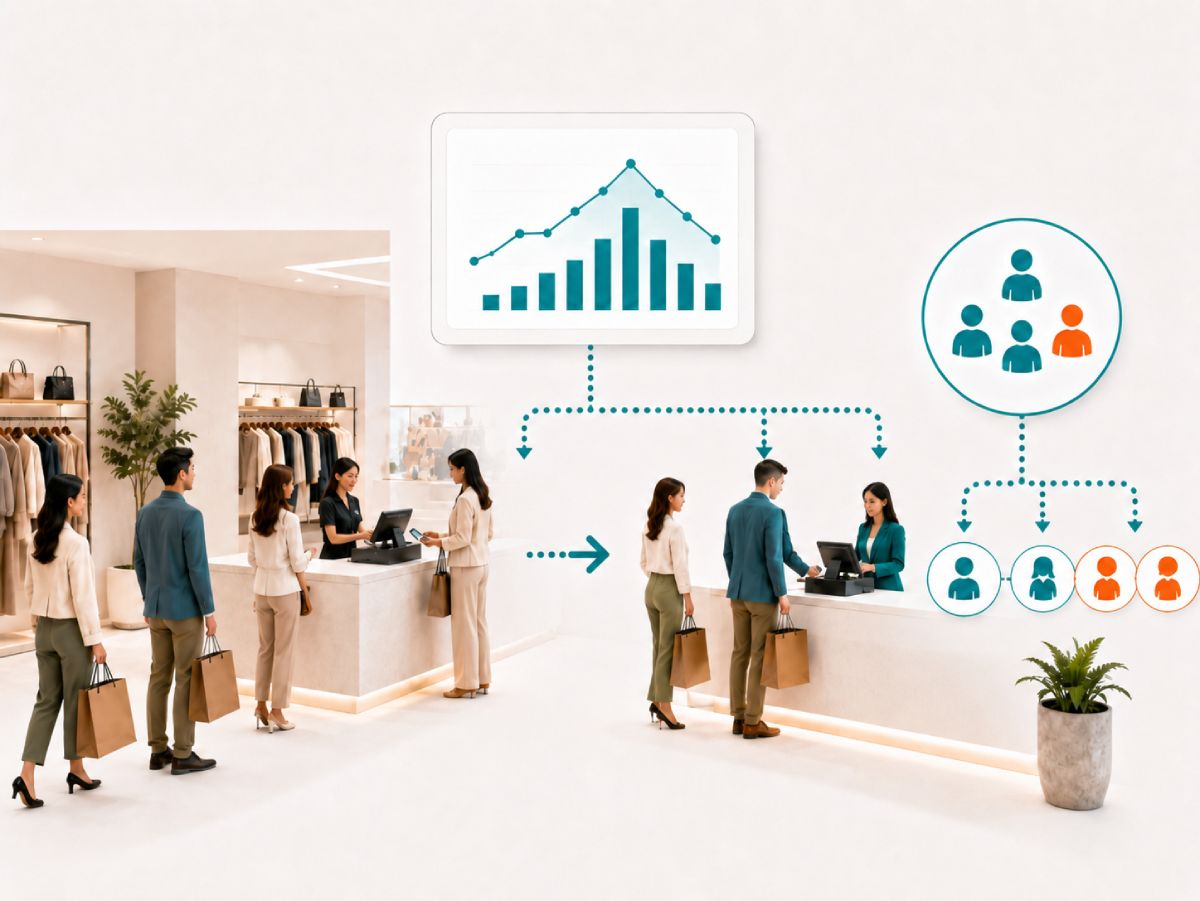
For retail leadership, footfall isn’t just a count. The insights that change operations are typically built from:
- Traffic patterns (hour-by-hour demand curves)
- Occupancy (how many people are in the store right now)
- Line/zone activity (what’s happening at key operational points like entry/exit)
This is the foundation of modern store performance analytics: turning traffic and occupancy into repeatable decisions on staffing, service levels, and execution.
Why Dedicated Sensors Matter for Decision-Grade Store Performance Analytics
Retail chains don’t need “interesting data.” They need reliable data that stands up across:
- different store layouts
- different lighting conditions
- peak traffic density
- seasonal changes and operating hours
That’s why dedicated counting technology matters. It’s designed to deliver consistent operational signals, not just “raw interpretation.”
The SensMax Approach: TAC-B + SensWeb
TAC-B: Retail-Ready Counting Lines/Zones + Real-Time Occupancy
SensMax TAC-B is built for operational analytics. It provides:
- 5 user-defined counting lines/zones to match real store logic (entrances, queue line, click-and-collect point, high-priority areas)
- real-time occupancy updates every 2–10 seconds so store teams can respond while issues are happening
- performance that works in any lighting, so insights remain stable across morning glare, evening conditions, and seasonal lighting changes
The result is a clean measurement layer that operations teams can trust.
SensWeb: Turning Signals Into “Business Answers”
Counting is step one. SensWeb is where retail footfall insights become Business Answers. It gives directors various insights they can use to run stores:
- traffic by hour/day/week
- peak periods and demand shifts
- occupancy peaks (and when they occur)
- benchmarking across locations
- operational trends that support consistent decision-making
This helps get clear answers to various business bottlenecks and inefficiencies.
6 Operational Playbooks Powered by Retail Footfall Insights
Retail footfall insights help businesses and managers improve execution in different ways.
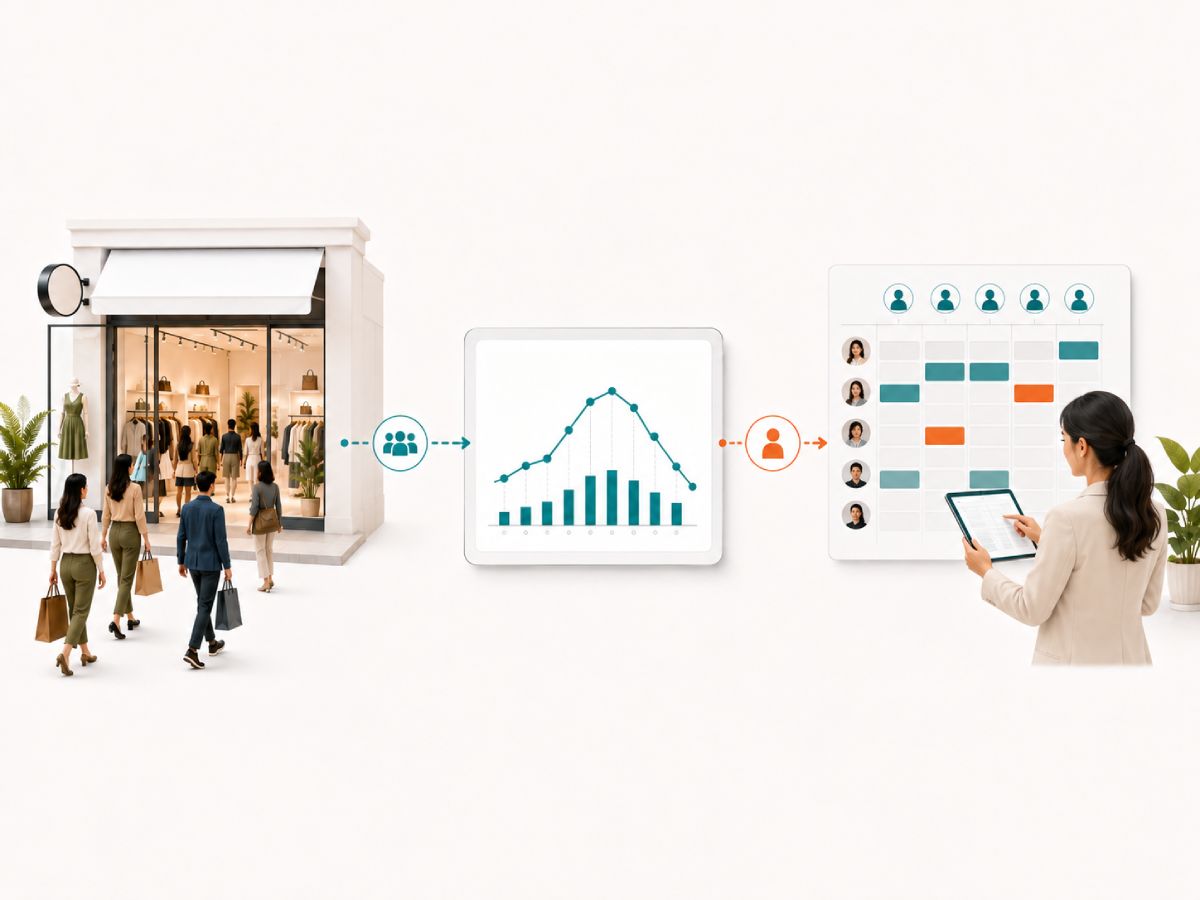
1) Staffing: Match Coverage to Real Demand (Not Guesswork)
When store traffic rises faster than expected, it leads to longer waits, fewer assisted sales, and conversion drops.
Use store performance analytics to:
- staff peaks based on hourly demand curves
- avoid shift handovers during known rush windows
- adjust skill mix (experienced staff) during high-occupancy periods
With reliable signals feeding SensWeb, staffing becomes a measurable optimization loop.
2) Queue & Checkout Flow: Fix Bottlenecks Before They Hit Conversion
Queues can form unexpectedly, leading to low customer satisfaction.
With real-time occupancy (2–10 second updates) and clear line/zone definitions, teams can:
- trigger additional checkout coverage during occupancy surges
- validate whether “open one more till” actually reduces pressure windows
- compare peak-time service performance across stores using the same baseline
These analytics help protect conversion during peak spikes.
3) Store Execution: Prove Whether Changes Work (Instead of Debating Opinions)
Operational changes fail when they’re rolled out without measurement.
Use retail footfall insights to run controlled tests:
- make one change (rota adjustment, service role assignment, queue coverage)
- measure impact across the same time windows
- standardize what works across similar stores
This is how chains turn isolated improvements into scalable operating standards.
4) Conversion Context: Stop Judging Stores on Sales Alone
Two stores can post the same revenue with completely different underlying performance.
When you combine footfall counts with transaction totals, you get the missing denominator for conversion analysis:
- Did conversion fall because the team executed poorly?
- Or did traffic spike beyond service capacity?
This is the heart of store performance analytics as it helps with contextual performance management.

5) Occupancy Management: Prevent “Silent” Service Failures
Occupancy spikes are where customer experience can degrade quietly, leading to fewer interactions, longer time-to-assist, and higher drop-off.
Because TAC-B provides frequent occupancy updates, stores can:
- respond during high-pressure windows
- identify the repeating patterns (e.g., Saturdays 3–6 pm)
- build predictable coverage plans to protect service levels
6) Benchmarking: Identify the Stores to Copy (and the Stores That Need Help)
Retail footfall insights become strategic when they’re standardized across the network.
Use SensWeb reporting to:
- benchmark stores with similar formats and demand patterns
- identify outliers (strong or weak) early
- replicate the operational behaviors that consistently win
This is how store performance analytics becomes a management system—not a report archive.
A Simple Cadence That Makes Footfall Operational
If you want retail footfall insights to drive action, build a rhythm:
- Daily: occupancy and peak-time review for store teams
- Weekly: traffic + conversion + staffing alignment
- Monthly: benchmarking, outlier diagnosis, standardization of best practices
Reliable measurement → consistent reporting → repeatable improvement.
The Only Footfall Insights That Matter Are the Ones You Can Act On
In 2026, foot traffic measurement only has value if it drives reliable business decisions.
That’s why the strongest path for retail chains is:
- measure with dedicated technology built for operations (TAC-B with 5 user-defined lines/zones, real-time occupancy, any-lighting performance)
- turn signals into Business Answers through SensWeb
- use the insights as a weekly operating discipline for staffing, queue flow, and performance management
Talk to SensMax to map your entrances and operational zones
