People counting & customer survey software
Footfall Analytics Software for People Counting + Customer Surveys
If you’re running multiple locations, the hardest part isn’t collecting numbers – it’s turning them into decisions. SensMax footfall analytics software helps you turn people counting and customer survey data into clear reports, ready-to-use business reports, and exports – using the SensWeb cloud reporting platform or a local reporting application installed on a PC.
At A Glance
Cloud or local reporting: use the SensWeb cloud reporting platform or a local PC application
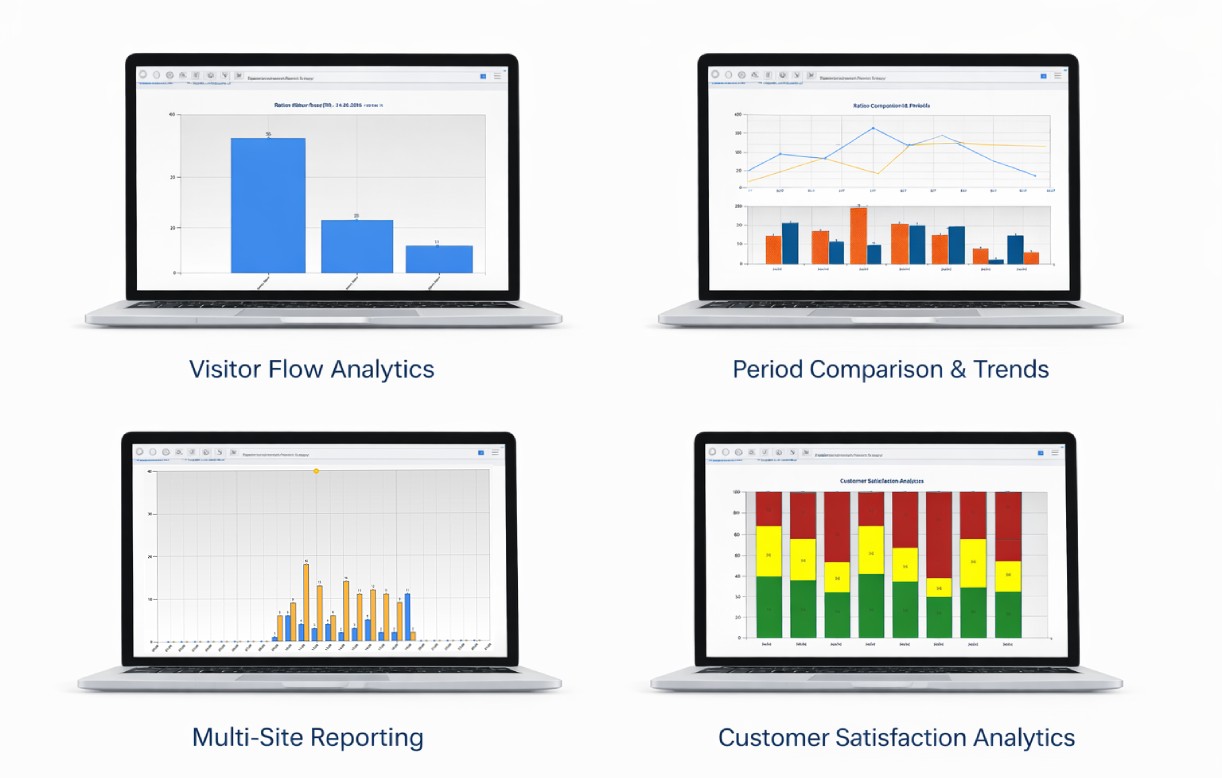
20+ reports: statistical, analytical, administrative, and financial reporting built in
Combine traffic + sales: import cash register financial statistics for traffic-and-income reports
Flexible time views: from 5 minutes to year-level reporting
Real-time option: Timestamp devices can update reports every 2–10 seconds
Exports + integrations: export reports to PDF and export data via API for third-party reporting
Aggregated reports across multiple locations with unified dashboards and comparisons
Why Footfall Analytics Software Instead of Spreadsheets
Good operations don’t run on “gut feel.” They run on consistency – one reporting logic across all sites, one way to compare weeks, and one place to align traffic, revenue, and customer feedback.
SensMax footfall analytics software is built to answer the questions that actually matter:
- Which sites are growing – and which are quietly declining?
- What does traffic look like by hour/day/week, so staffing matches real demand?
- Are we improving customer experience (not just footfall) with NPS and survey trends?
See what this looks like on your locations.
How SensMax Footfall Analytics Software Works
- Devices collect data: wireless people-counting sensors and customer survey buttons collect statistical information.
- Data reaches the database: standard delivery is via LAN/Internet or WiFi gateways every ~20 minutes.
- Real-time when needed: with SensMax Timestamp devices, reporting can update every 2–10 seconds (real-time mode).
- You build reporting views: create reports, group sensors, set user access rights, and export reporting outputs (PDF).
- Integrate upstream: online reporting supports data export via API for third-party reporting systems.
SensMax software has an option to send notifications via email or Telegram messenger
Business Benefits
This is where footfall analytics software earns its keep – when it helps leadership and operations teams act faster and with more confidence.
Use Footfall Analytics Software To:
- See performance by site or group: view statistics per sensor or sensor group, organized for multi-site reporting.
- Compare time periods cleanly: report by 5 minutes, hour, day, week, month, and year – so trends are visible, not hidden.
- Connect traffic to commercial outcomes: import cash register financial statistics for combined traffic and income reporting.
- Track occupancy in real time: use occupancy and live reporting views for current “people inside” visibility.
- Manage issues proactively: error reporting highlights conditions such as low battery/offline/blocked devices.
- Measure customer experience alongside footfall: add Loyalty Button surveys and use built-in Net Promoter Score reporting.
Where This Footfall Analytics Software Fits Best
SensMax footfall analytics software is a practical fit when you’re managing:
- Retail stores and multi-site chains (traffic trends + performance comparison)
- Shopping centres (groups, cross-zone views, reporting access control)
- Public-facing buildings and facilities (occupancy visibility and reporting)
- Any environment where customer survey signals (Loyalty Button + NPS) should sit alongside footfall reporting
SensWeb Cloud Reporting Platform
You have two ways to run footfall analytics software – and the right choice depends on how your organization operates:
Option 1: SensWeb cloud reporting platform
Use the SensWeb cloud reporting platform for online reporting, multi-user access, exports, and integration-friendly workflows.
Option 2: Local reporting application (PC)
Prefer an on-prem style workflow? Use the local application installed on a PC. It supports multi-user environments and access rights.
Built For Managers – And Still Integrator-Friendly
- User access rights: set permissions per user in a multi-user environment.
- Automatic data download: EasyReport supports automatic data downloading from the SensWeb cloud reporting platform or a locally installed SensMax Server software.
- Exportable reporting: export reports in PDF.
- API export: online portal supports API export for third-party reporting systems.
Technical Overview
Core reporting capability
- 20+ reports spanning statistical, analytical, administrative, and financial views
- Report time spans: 5 minutes → year (including hour/day/week/month/year)
- Grouping + structure: add sensors into groups; view per sensor or group in a multi-level tree
- PDF export for sharing and documentation
- API export for integrations with external reporting systems
Data delivery
- Standard devices: data delivered every ~20 minutes via LAN/Internet or WiFi gateways
- Timestamp devices: real-time updates every 2–10 seconds (real-time mode works with Timestamp devices)
Customer survey + NPS
- Add SensMax Loyalty Button surveys into the same reporting environment
- Get survey summaries (daily for standard devices) and more granular views for Timestamp devices (5 minutes / 1 hour)
- Built-in Net Promoter Score (NPS) reporting
Automation + monitoring (as listed)
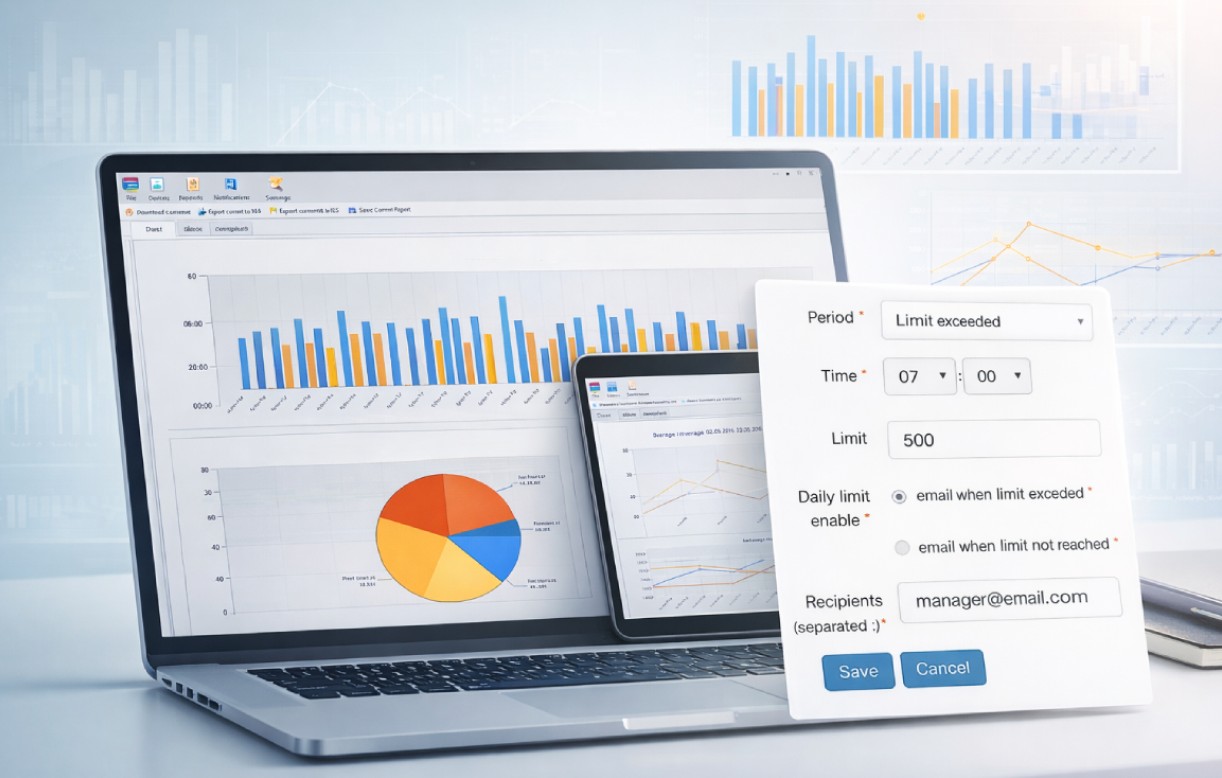
- Auto report scheduling to email (e.g., daily, weekday rules, first day of month)
- Triggered emails (e.g., error conditions; limit exceeded; every X visitor)
- Email notification when Loyalty Button is pressed
- Telegram messenger notifications
FAQ
Is This Footfall Analytics Software Cloud-Only?
No – SensMax supports both the SensWeb cloud reporting platform and a local PC application.
How Often Does Reporting Update?
Standard devices deliver data every ~20 minutes. With SensMax Timestamp devices, reports can update every 2–10 seconds in real-time mode.
Can We Combine Footfall And Sales Performance?
Yes – there’s an option to import financial statistics from cash registers for combined people traffic and income reporting.
Can Different Teams Have Different Access?
Yes – the application supports multi-user environments and lets you set access rights per user.
Can We Export Or Integrate The Data?
Yes – reports can be exported in PDF, and the online portal supports API export for third-party reporting systems.
Does It Support Customer Surveys and NPS?
Yes – you can add the Loyalty Button for surveys, and there is a ready-to-use Net Promoter Score report.
See how SensMax footfall analytics software looks with your real locations, your real time periods, and your reporting requirements – using the SensWeb cloud reporting platform or a local PC application.
