
The Real Cost Of “Almost Right” Schedules
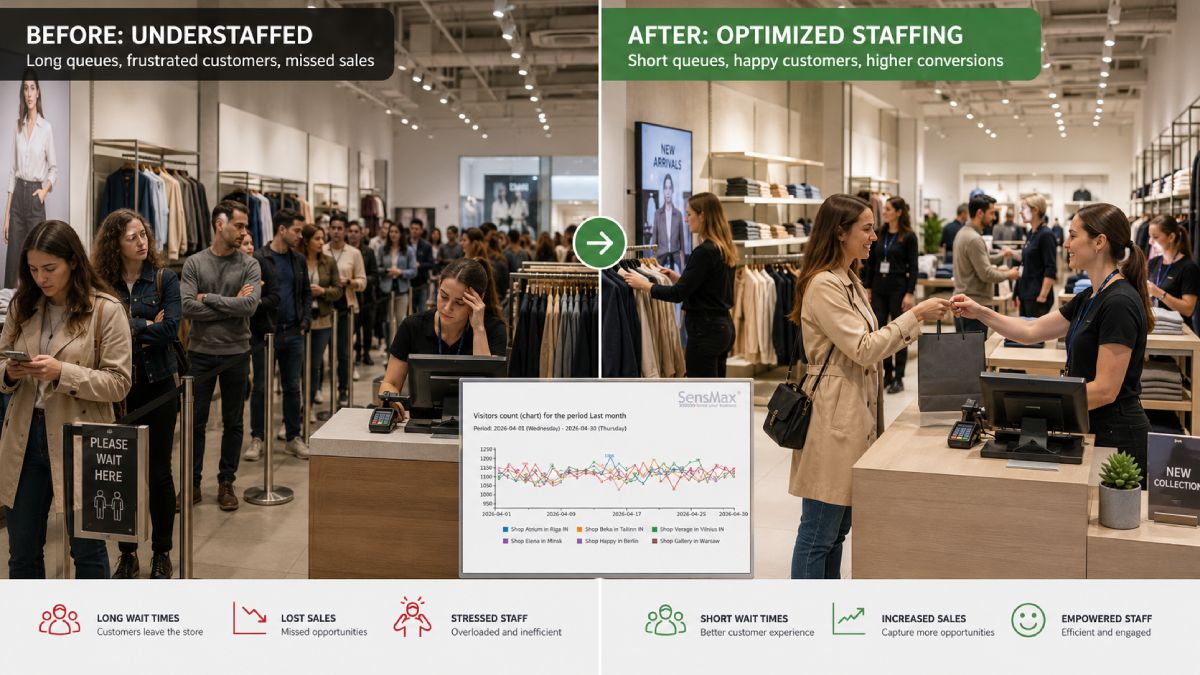
Most organisations use a mix of instinct, past sales, and floor observation to build staffing. The common pattern is predictable: some days the store is slammed and staff are stretched thin; other days employees are underutilised while labour costs keep running. People counting removes the guesswork and supports staffing optimisation by grounding decisions in what visitors actually do.
- Busy periods you didn’t staff to create service friction (long waits, fewer assisted sales, weaker experience).
- Quiet periods you did staff for inflated labour costs without adding customer value.
- “Sales-only” reviews hide missed opportunities because POS systems show what was bought, not who was there.
That’s why data-driven footfall scheduling matters: it separates demand (visitors) from performance (conversion), so you can fix the right problem and keep staffing optimization factual instead of emotional.
Why POS Data Can’t Schedule Your Store (By Itself)
POS tells you revenue, transactions, and product mix. It cannot tell you how many people walked in, when traffic peaked, or whether coverage was sufficient. That missing context is exactly why demand-based schedules drift away from reality over time.
- A “slow” sales hour might actually have healthy traffic but weak conversion due to undercoverage.
- A “great” sales hour might be a few large transactions, not broad store demand.
- Cutting hours based on sales alone can accidentally worsen the real issue (service capacity), reducing conversion further.
When you move to data-driven footfall scheduling, you’re no longer guessing. You’re planning proactively around traffic patterns across the day, week, and season, which is classic staffing optimisation work, but finally with evidence.
The People-Counting Metrics That Actually Help Staffing
You don’t need “more data.” You need the right demand signals surfaced clearly, ideally in one dashboard view. Retail dashboards consolidate metrics into a real-time view and can support demand forecasting through predictive analytics.
- Hourly Entry Counts
Shows your true peak windows (often different from sales peaks). - Day-Of-Week Patterns
Separates repeatable rhythms from one-off anomalies. - Traffic + Sales Together
Reveals high-traffic/low-conversion periods you can fix with coverage, not discounts. - Trend Views
Supports planning as demand shifts (seasonality, promos, local events).
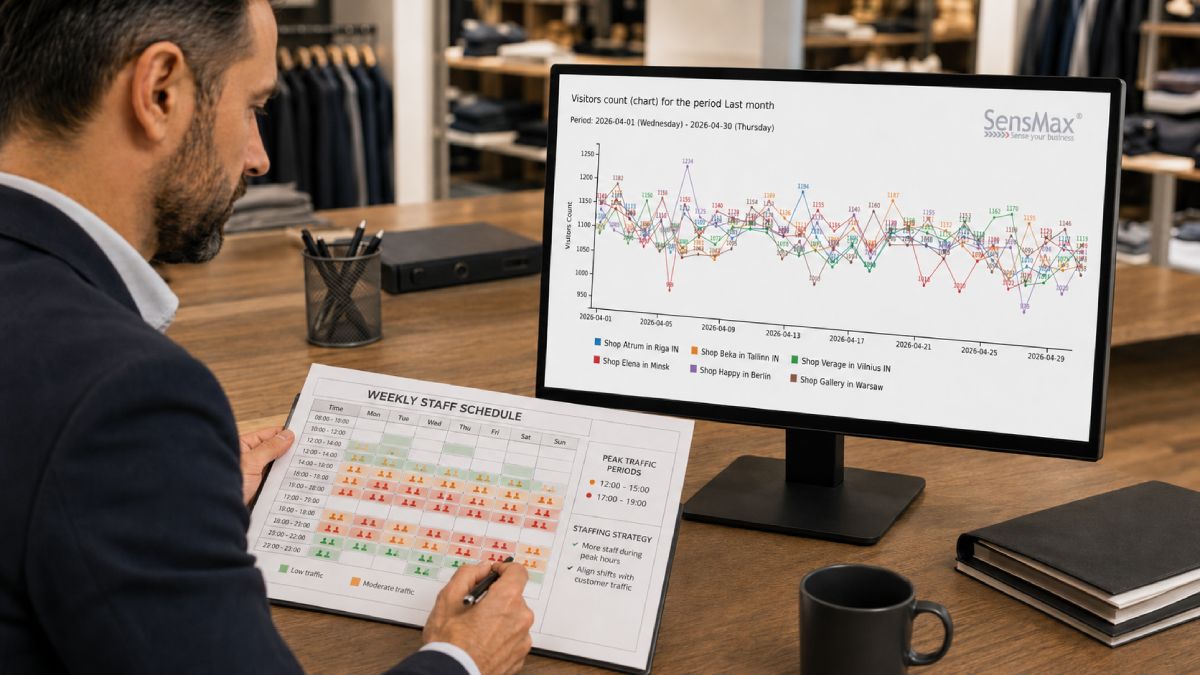
This is where data-driven footfall scheduling becomes operational: you turn traffic curves into dayparts, then attach staffing requirements to each daypart for staffing optimisation that doesn’t depend on one manager’s memory.
A Practical Workflow For Data-Driven Footfall Scheduling
Once you have clean entrance traffic data, the scheduling method is straightforward. People counting shows when people arrive and how traffic fluctuates over time which gives you the timing clarity that averages and sales data often hide.
- Step 1: Baseline Traffic By Hour/Day
Identify recurring peaks and short surges (the “busy 45 minutes” that wrecks CX). - Step 2: Define Coverage Thresholds
Decide what “good service” looks like (e.g., queue tolerance, floor coverage zones). - Step 3: Map Traffic To Roles
Peak windows need more customer-facing staff; slower windows may shift to replenishment/ops. - Step 4: Validate With Outcomes
Compare traffic context with conversion and revenue to confirm you fixed the real constraint.
Do this consistently and data-driven footfall scheduling stops being a “project” and becomes ongoing staffing optimisation; small weekly tweaks instead of painful monthly overhauls.
Why Ready-To-Use Business Reports (Like SensWeb) Make Staffing Optimisation Stick
Even good data fails if it lives in someone’s inbox. Dashboards matter because they unify signals and make them visible to everyone who needs to act fast. Retail dashboards are designed to provide a real-time view of key metrics and enable quicker decisions as demand changes.
SensMax’s reporting approach is a useful model for how to operationalise this: their people counting software supports cloud reporting (via SensWeb) or local reporting, includes 20+ report types, and lets teams view stats per sensor or sensor group across multiple time spans (from 5 minutes up to yearly).
- Importantly for store management, it can also import financial stats from cash registers to create combined traffic + income reporting, helpful when you’re validating whether data-driven footfall scheduling improved conversion, not just “busyness.”
- For near-real-time operations, Timestamp-enabled devices can update reports every 2–10 seconds, which is useful for live occupancy and peak management.
That kind of visibility is what sustains staffing optimisation: schedules improve when performance conversations are built on shared, objective reporting, not anecdotes.
Multi-Location Demand: Why Outdoor + Indoor Counts Improve Data-Driven Footfall Scheduling
If you operate multiple stores (or large sites), demand signals vary by location and by “approach path.” Outdoor counting can add an early-warning layer before shoppers even hit the door.
For example, SensMax describes camera-free outdoor people counters (including radar options with built-in 4G/LTE) designed for real-time pedestrian/cyclist counting and outdoor conditions; their outdoor radar coverage is described as up to 100 m² with up to five counting lines/zones.
- Outside traffic surges can cue earlier staffing adjustments (greeter, queue, fitting rooms, checkout).
- Different entrances behave differently (mall entrance vs street entrance), which changes where you need people.
- Outdoor sites without power/internet can still be tracked using battery-powered outdoor sensors designed for remote areas.
This is a powerful upgrade for data-driven footfall scheduling because your schedule is no longer blind to what’s happening outside the store. This makes staffing optimization more proactive.
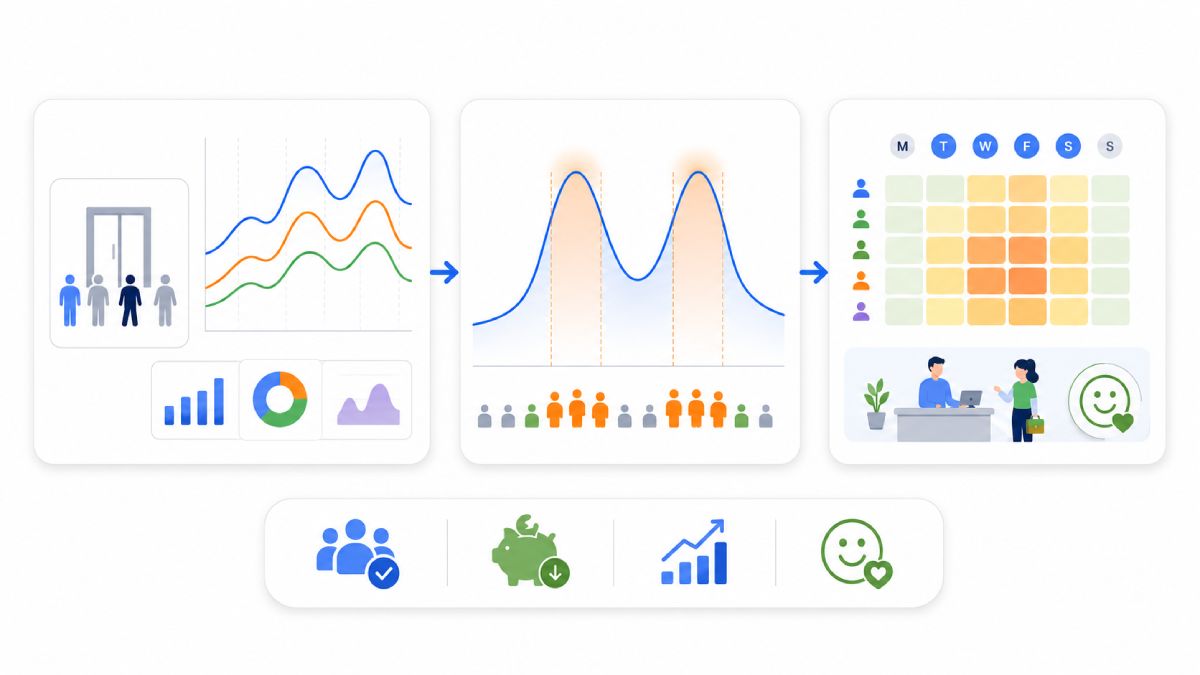
How Demand Curves Replace Static Roster Templates
Traditional roster templates assume demand is stable and repeatable. In reality, customer traffic rises and falls by hour, by location, and by context. Data-driven footfall scheduling replaces fixed templates with demand curves built from actual visitor patterns. These curves show when traffic builds, how long peaks last, and where short surges occur that static schedules routinely miss.
When staffing is aligned to demand curves instead of averages, staffing optimisation becomes more precise. Coverage increases where customers actually need help, while low-demand periods can be staffed leaner without hurting experience. Over time, rosters evolve from copied templates into living schedules that adjust as traffic behavior changes.
Where Most Staffing Optimisation Efforts Quietly Fail
Many staffing optimization initiatives fail not because the idea is wrong, but because the input data is incomplete. Teams often rely on sales data alone, which hides unmet demand and service gaps. A low-sales hour may still have high traffic that wasn’t converted due to undercoverage, but without footfall context, that failure remains invisible.
Another common failure point is treating scheduling as a periodic task instead of a continuous process. Without consistent data-driven footfall scheduling, rosters lag behind reality as traffic patterns shift due to seasonality, promotions, or external events. The result is gradual misalignment that feels like “normal retail chaos” rather than a fixable systems issue.
The 2026 Playbook For Staffing Optimisation
In 2026, the retailers who win won’t be the ones who work harder on schedules, they’ll be the ones who make scheduling a measurable system. People counting provides the demand layer POS can’t, ready-to-use business reports make it visible, and tools like SensWeb-style reporting (groups, time-based reports, exports, and traffic + financial context) help teams keep staffing optimisation continuous.
If you adopt data-driven footfall scheduling properly, you’ll stop reacting to surprises and start staffing to predictable patterns, which, will improve customer experience, controlling labour cost, and making store performance easier to manage week after week.
